As you may have seen on Twitter, we've recently set up an IKEA VÄXER hydroponics system and decked it out with a Pi Zero and camera, and a bevy of Flotilla modules to monitor it.
We thought we'd do a quick blog post to take you through the setup and hopefully to inspire you to do something similar.
UPDATE: You can now grab the code for our Internet of Seeds on GitHub.
Hydroponics
Hydroponics is a cultivation system that uses a growth substrate other than soil (like gravel), minimal nutrients and usually artificial light to grow plants. The aim is to have a fast, efficient means of growing food crops that isn't dependent on farmland, rainfall and daylight.
Much of the work on hydroponic growing systems has been done by NASA, with a view to being able to grow food off-Earth on planets like Mars. Recently, though, IKEA have developed a tiny hydroponics system that you can use indoors to grow plants like lettuce and herbs quickly and cheaply.
IKEA VÄXER system
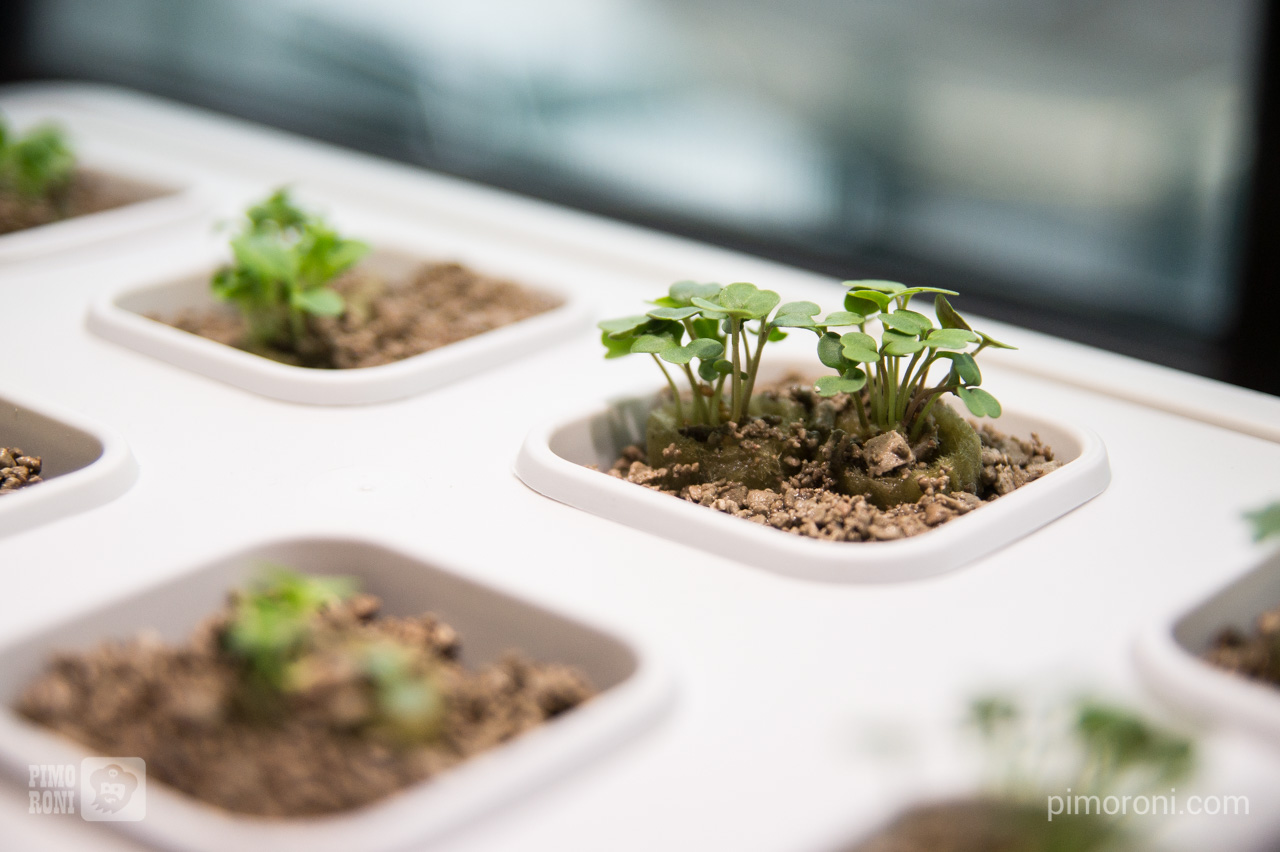
The VÄXER system consists of a couple of plastic trays - one for germination and one for growth - that sit inside a tray of water and a metal light fixture that's mounted above the tray. There are a few variants of it, with a sleeker black and galvanised metal version, and versions that have several tiers. The cheapest kit with space for 8 plants costs a very reasonable £45.50 and can be used multiple times. Their packets of seeds come in bundles of 3 packs and cost 50p per pack.
The seeds are germinated on small rock wool plugs for 5-7 days suspended in water, and then transferred into small pots with pumice gravel that are also suspended in the tray of water with added fertiliser to keep them constantly hydrated.
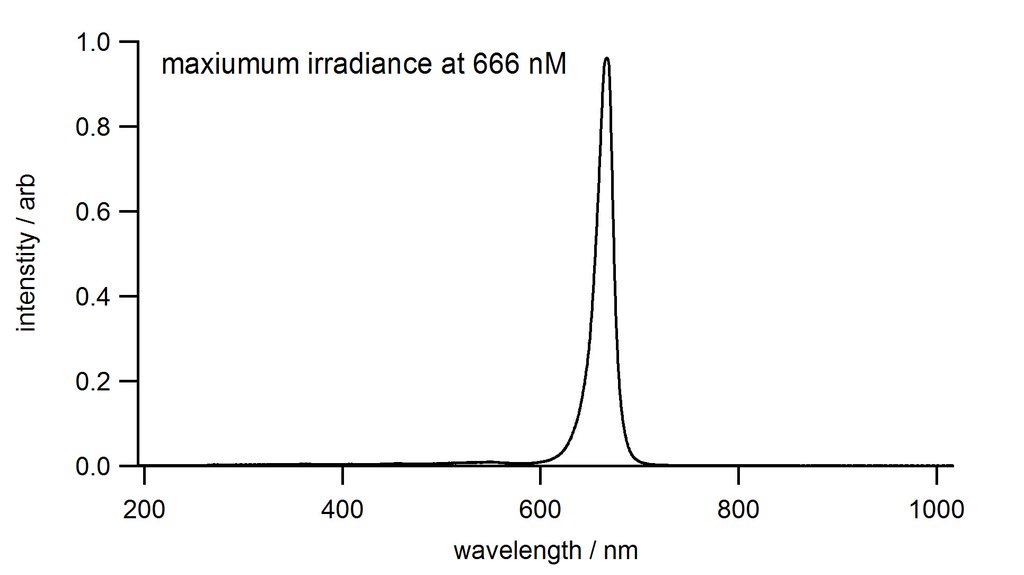
The lighting is a strip light with 3 sets of LEDs, each with 2 white and 1 red LED. It seems that the red LEDs may promote flowering and fruiting, if you're growing that sort of plant. In the interests of science, we had our friend Nate Adams at the University of Sheffield test the wavelength of light produced by these red LEDs with a spectrometer. He found that they produce red light with a wavelength of 666 nM (!!), relatively deep into the red end of the spectrum, closer to infrared.
The kit is fairly simple to assemble, only requiring unpacking, screwing the LED light onto the fixture, and attaching the fixture to the tray.
IKEA suggest that (depending on the plant species) growth from seed to harvest takes between 4 and 6 weeks in total.
IoT all the things!
What with the launch of IKEA's hydroponics system coinciding nicely with the launch of the new Pi Zero with camera connector, we decided we should use one to monitor our VÄXER! And while we were at it, why not use our Flotilla system to monitor it?
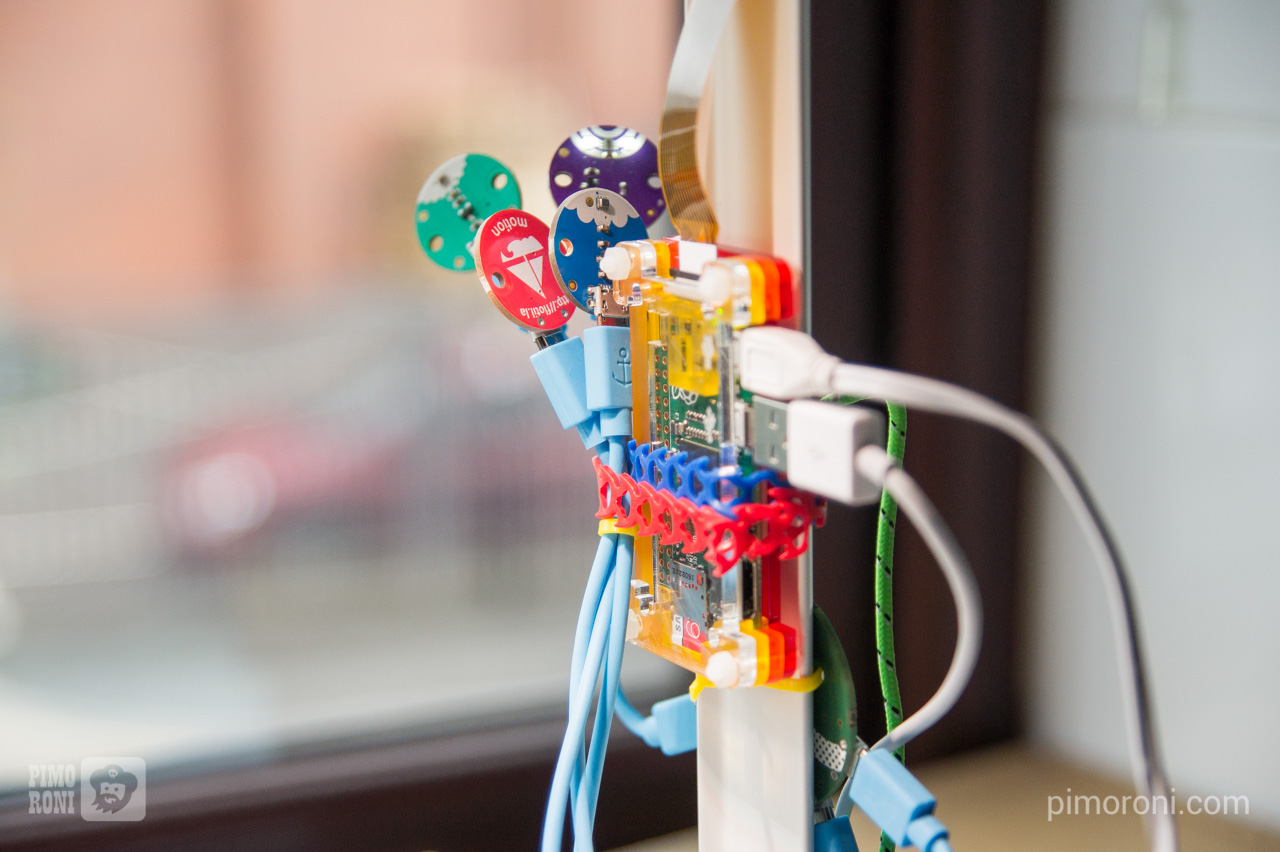
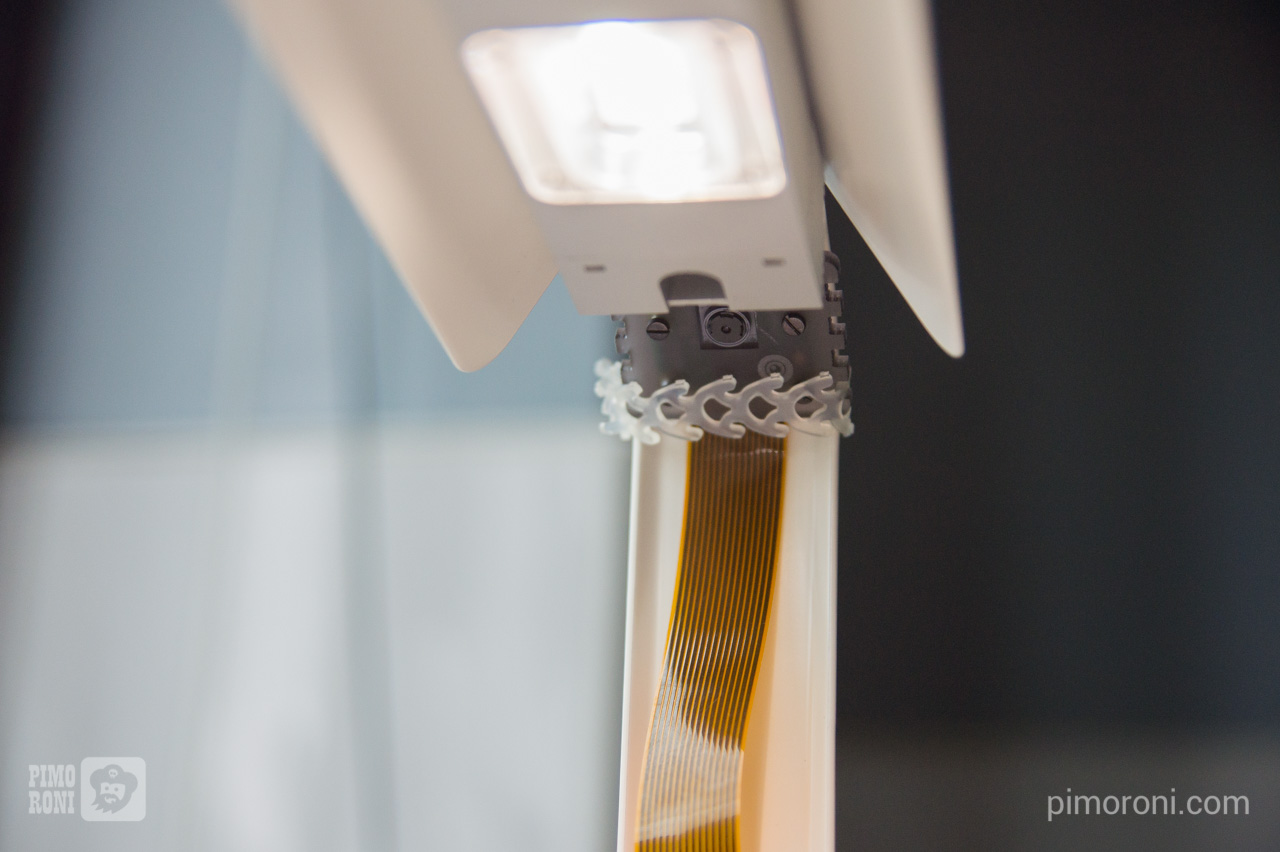
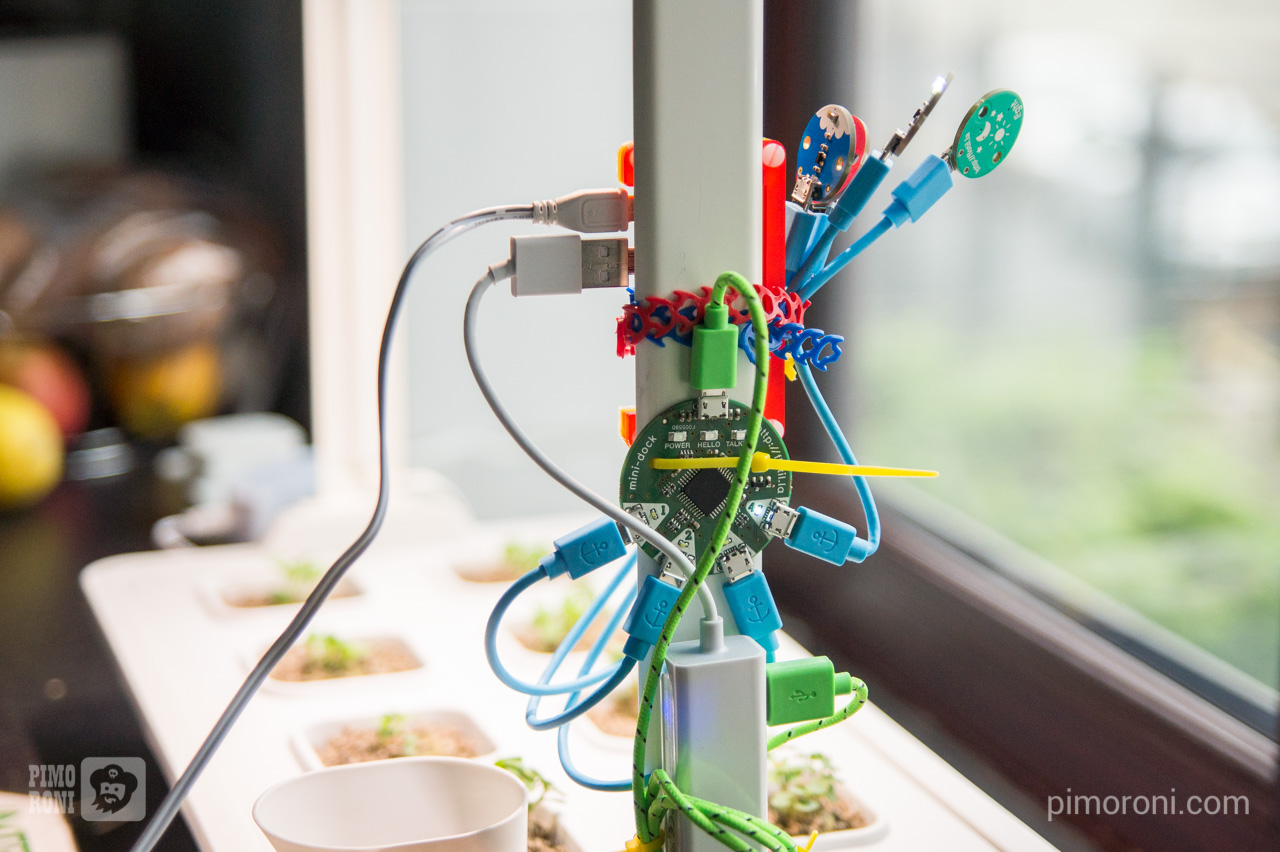
It turns out that the metal uprights that support the LED lights are almost the same width as a Pi Zero in one of our Pibow cases - perfect! We attached one with a Rapstrap cable tie, ran the camera cable up the metal upright, and then attached the camera with another Rapstrap.
We used one of our 3 port USB hubs with ethernet to provide a more reliable internet connection than wifi and to connect the Flotilla dock by USB.
The Flotilla dock is mounted to the upright with cable ties, and the Flotilla modules were initially mounted with Velcro dots inside the protective lid during the germination stage, but are now mounted on the upright too, since the lid has been removed for the second stage of growth.
Flotilla modules
We're using the light, weather, colour and motion Flotilla modules to monitor our plants. This allows us to measure the light level in lux, the temperature and atmospheric pressure, the light colour and any motion that might occur from the unit being disturbed (although we're currently not logging the motion values).
Each of our Flotilla modules has mounting holes that make them ideal for mounting to whatever you'd like or, as we did, you can use Velcro dots or Blu-Tack to mount them.
Our Flotilla system has a super-simple programming environment called Rockpool, where you can string together different modules and rules, but also has a full Python library that you can use to interact with the modules and delve deeper. Here, we've used the Python library to read from the 4 modules.
All of the modules connect to the dock via micro USB - micro USB cables and the dock connects to the Pi Zero via a micro USB - USB cable. The dock's job is to read and write data to and from each connected module and then feed that data to and from the Pi Zero.
Data logging
In a nutshell, we have two separate Python scripts that do i) the data logging and, ii) pushing the watermarked images and data to Twitter. These both run at set intervals defined in cron jobs.
Our first Python script, that does most of the heavy lifting, works as follows.
First, we import a few libraries. We need the os and shutil libraries for some file-related jobs, the picamera library for taking the photos, PIL (the Python Image Library) for processing our photos, and the flotilla library for interacting with our Flotilla modules.
import os
import shutil
import datetime
import picamera
import PIL
from PIL import Image, ImageFont, ImageDraw
import flotilla
Next, we have a series of functions that define the different jobs we want to perform.
- Capturing an image
- Converting the sensor data to a text string that can be overlayed on the image
- Timestamping the image, overlaying the sensor data and watermarking
- Reading the sensor data
- Logging all of the sensor data
First, the image capture function.
def capture_image(t):
  ts = t.strftime('%Y-%m-%d-%H-%M')
  cam = picamera.PiCamera()
  cam.resolution = (3280, 2464)
  cam.hflip = True
  cam.vflip = True
  filename = '/home/pi/internet-of-seeds/image-' + t.strftime('%Y-%m-%d-%H-%M') + '.jpg'
  cam.capture(filename, quality=100)
  shutil.copy2(filename, '/home/pi/internet-of-seeds/latest.jpg')
  return filename
Important things to note here are the following. First, we have to define a resolution for the image being captured, otherwise the resolution of our display is used. We only discovered this after almost a week of capturing low res. images, and it seems like a strange default rather than capturing full res. images. Second, you might need to flip the image horizontally and vertically depending on which way up your camera is. Last, as well as the timestamped image files, we make a copy and save it as latest.jpg, which will later become latest_ts.jpg once it's timestamped. This makes it really easy to pass this file name to the function that will tweet our images later, rather than hunting for the most recent timestamped filename.
Next, the function to convert our sensor data to a formatted text string.
def sensor_vals_as_string(sensor_vals):
  sensor_str = 'Temp: %.2f C, Press: %.2f hPa, Light: %i lux, RGB: %i,%i,%i.' % (sensor_vals['temperature'], sensor_vals['pressure'], sensor_vals['light'], sensor_vals['colour'][0], sensor_vals['colour'][1], sensor_vals['colour'][2])
  return sensor_str
This is pretty straightforward, with placeholders for all of the values, which come as a dictionary, and trimming the floating point numbers to two decimal places.
Next, our function to timestamp, watermark and overlay the sensor data on our image.
def timestamp_image(t, sensor_vals):
  ts_read = t.strftime('%H:%M, %a. %d %b %Y')
  sensor_str = sensor_vals_as_string(sensor_vals)
  img = Image.open('/home/pi/internet-of-seeds/latest.jpg')
  wm = Image.open('/home/pi/watermark.png')
  img = img.resize((1438, 1080))
  img.paste(wm, (0, 996), wm)
  draw = ImageDraw.Draw(img)
  font = ImageFont.truetype('/home/pi/roboto/Roboto-Regular.ttf', 36)
  draw.text((10, 10), ts_read, (255, 255, 255), font=font)
  draw.text((10, 46), sensor_str, (255, 255, 255), font=font)
  filename = '/home/pi/internet-of-seeds/latest_ts.jpg'
  img.save(filename)
  return filename
We're doing a few things with PIL here. First, we're resizing the image from full res. to 1080p, to make it slightly more efficient for uploading/downloading to/from the web. We're using the paste function to overlay our watermark towards the bottom of the image. Last, we're using draw.text to timestamp and overlay our sensor data at the top left of the image.
Next, comes quite a lengthy function to read the motion, light, colour and weather sensor values and then read them into a dictionary.
def read_sensors():
  client = flotilla.Client()
  while not client.ready:
    pass
  motion = client.first(flotilla.Motion)
  light = client.first(flotilla.Light)
  colour = client.first(flotilla.Colour)
  weather = client.first(flotilla.Weather)
  vals = {}
  vals['motion'] = (motion.x, motion.y, motion.z)
  vals['light'] = light.lux
  r = int(colour.red/float(colour.clear)*255)
  g = int(colour.green/float(colour.clear)*255)
  b = int(colour.blue/float(colour.clear)*255)
  vals['colour'] = (r, g, b)
  vals['temperature'] = weather.temperature
  vals['pressure'] = weather.pressure / 10.0
  client.stop()
  return vals
For the colour data, we have to use the colour sensor's clear value to calculate the red, green and blue values and then multiply by 255 to get a conventional RGB value. We divide the pressure by 10 to convert it to hectopascals (hPa).
Our last function logs the sensor values and timestamps to a tab-separated text file, so that we have a full log of all of the data captured that we can analyse later.
def log_values(t, sensor_vals):
  filename = '/home/pi/internet-of-seeds/internet-of-seeds.log'
  ts = t.strftime('%Y-%m-%d-%H-%M')
  sensor_str = '%s\t%.2f\t%.2f\t%i\t%i\t%i\t%i\n' % (ts, sensor_vals['temperature'], sensor_vals['pressure'], sensor_vals['light'], sensor_vals['colour'][0], sensor_vals['colour'][1], sensor_vals['colour'][2])
  if not os.path.isfile(filename):
    out = open(filename, 'a')
    out.write('time\ttemp\tpress\tlight\tred\tgreen\tblue\n')
    out.write(sensor_str)
  else:
    out = open(filename, 'a')
    out.write(sensor_str)
  out.close()
Right at the bottom of our program, we have a few lines that run each of the functions and pass in the time and sensor values.
t = datetime.datetime.now()
img = capture_image(t)
sensor_vals = read_sensors()
latest = timestamp_image(t, sensor_vals)
log_values(t, sensor_vals)
Tweeting
Our second script, to tweet periodically the data and timestamped images, is really simple. It uses the fantastic Tweepy library to do all of the hard work.
We also have to register as a Twitter developer to get API keys, but this is free to do.
Here's out entire script to tweet the latest image and data.
import tweepy

def tweet_pic(status, latest):
  ckey = ''
  csecret = ''
  akey = ''
  asecret = ''
  auth = tweepy.OAuthHandler(ckey, csecret)
  auth.set_access_token(akey, asecret)
  api = tweepy.API(auth)
  api.update_with_media(latest, status=status)

latest = '/home/pi/internet-of-seeds/latest_ts.jpg'

fn = '/home/pi/internet-of-seeds/internet-of-seeds.log'
with open(fn) as f:
  for l in f.readlines():
    pass

sensor_vals = l.rstrip().split('\t')
status = '%s: Temp: %s C, Press: %s hPa, Light: %s lux, RGB: %s,%s,%s.' % tuple(sensor_vals)
tweet_pic(status, latest)
Obviously, insert the consumer and access keys and secrets where appropriate, if you're doing this.
We take advantage of the way that Python reads files to grab the last line in our data log, which will be the most recently captured data. Python, when reading files in an iterative loop, reads in each line at a time so, by reading through all of them, our l variable becomes the last line of the file, eventually. Not the most efficient way to do it (using tail in bash and passing the last line in at the command line would be much faster), but appropriate for this use case.
Because we named our timestamped image latest_ts.jpg earlier, it's trivial to pass this image to the tweet_pic function that we've defined, right at the end of the script.
Cron jobs
We want to capture images and data every 10 minutes, to give us good resolution when analysing the data. These plants are going to grow fast!
Cron is an incredibly powerful program bundled with pretty much every Linux flavour. It allows you to run commands at defined time intervals - every 10 minutes, every day at 10.15am, every Wednesday at 12.34pm - you get the idea.
To add a new job to the cron table, you just type crontab -e and then add something like the following.
*/10 * * * * sh /home/pi/internet-of-seeds/internet-of-seeds.sh >> /home/pi/cron.log
05 00,06,12,18 * * * /home/pi/internet-of-seeds/internet-of-seeds-tweet.sh >> /home/pi/cron.log
We've written a couple of very simple bash scripts that run our data logging and image capture Python script (and also push the images and data to an Amazon S3 bucket, so that the data are available outside Twitter) and the tweeting. Because we want the images captured every 10 minutes, but the tweets only to be sent out 4 times daily - at 00:05, 06:05, 12:05 and 18:05 - we split the tweeting into a separate bash script.
In the first line, the */10 tells cron to run the command every 10 minutes, at 10 past the hour, 20 past the hour, etc.
In the second line, the part that reads 05 00,06,12,18 tells cron to run at 00:05, 06:05, 12:05 and 18:05. We chose 5 minutes past the hour, so that this tweeting script didn't run at the same time as the image capture and data logging script.
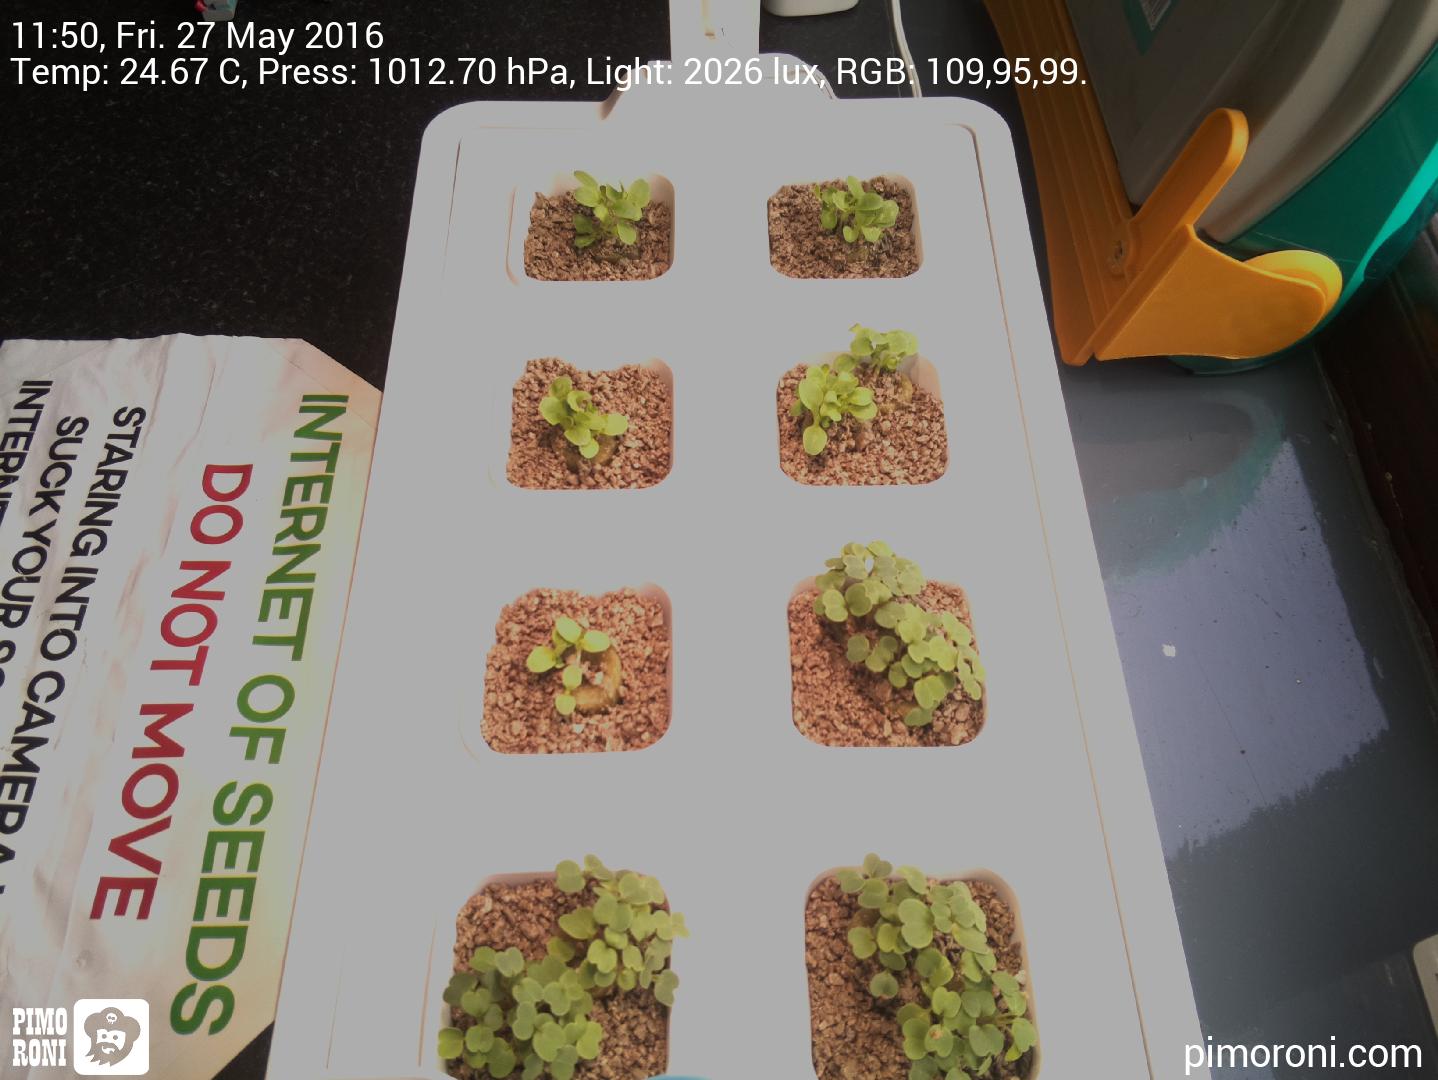
And here's what the final timestamped and watermarked images look like.
What next?
Now that the plants are at the seedling stage and a decent size, we'd like to use one of the Pi NoIR cameras with a blue filter to estimate the amount of green vegetative material (essentially, how much the plant is photosynthesising). This takes a bit of image manipulation to get just right, and we've had to write some custom code as the existing solutions just wouldn't run on the Pi Zero, but we think we've perfected it now. This is known as NDVI, the Normalised Difference Vegetation Index.
We'll also do some time lapse videos and some analysis of the data that we've been capturing, as well as trying to plot out the amount of growth from the NDVI images.